
A high-performing manufacturing facility will have a well-defined quality management system which includes incoming material inspection control. The controlling factor in all polymer conversion processes is the material’s rheological behaviour. The rheological behaviour of a polymer melt is highly sensitive to material structure. Rheological measurements can detect even the most discrete changes in structural properties and are therefore fast & accurate methods of providing quality control for many aspects within the process.
Introduction
Capillary rheometry can screen incoming raw materials to discriminate batch-to-batch variation. Thereby avoiding or reducing production issues, during extrusion or injection moulding, by characterizing viscosity and other rheological properties of molten polymers in a fast & reproducible manner. Capillary rheometers, such as the Dynisco LCR 7001 (Figure 1), are described by the main international standards ISO 11443 and ASTM D3835. They simulate process conditions and investigate the flow behaviours of thermoplastics as a function of temperature and flow speed. A certain quantity of thermoplastic sample is compacted inside a heated barrel becoming a homogeneous fluid. The molten sample is then forced through a capillary die of known dimensions while pressure is exerted on it by a piston. The test pressure is measured via a pressure transducer close to the die entrance. One type of test includes a series of different piston speeds at a controlled temperature and demonstrates how shear stress (proportional to the steady-state pressure at a certain speed) changes as a function of shear rate (speed of shear deformation). The typical result is the rheological curve that plots viscosity versus shear rate.
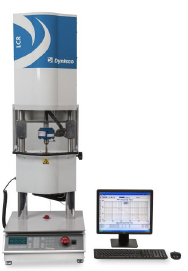
Figure 1: Dynisco LCR 7001
In the Applied Polymer Technologies CISD Laboratory, industrial rheological testing of 2 batches of the same PEEK material were characterised using the Dynisco LCR 7001 Capillary Rheometer. The objective was to understand the batch-to-batch variation and correlate the variation to the production processing issues being experienced by the client.
Polyether ether ketone (PEEK) is becoming a desirable polymer for use in many different applications within aerospace, medical and automotive industries. PEEK is commonly known as an engineering thermoplastic which is renowned for its high melting temperature chemical resistance and excellent mechanical properties. Consequently, PEEK is becoming popular in replacing metals where high strength and stiffness is needed. However, one disadvantage of PEEK is that it is expensive compared to other polymers in its class, such as POM and PMMA. Therefore, there is a strong argument to perform accurate incoming inspection tests to avoid unnecessary costs downstream in the production cycle. The main aim of this work was to investigate differences of each batch of material using the Dynisco LCR 7001 Capillary Rheometer.
Method
The rheological testes were carried out using a Dynisco LCR 7001 Capillary Rheometer. The measurement temperature was 390 °C. Prior to measurement, the PEEK was melted for 5 minuntes in the rheometer’s cylinder. A 2 mm-diameter and 40 mm-long cylindrical capillary with an inlet angle of 120° was used. The pressure of the molten polymer compound was determined before entry to the measuring capillary at a specified volumetric flowrate in the range corresponding to an apparent shear rate from 10 s−1 to 10,000 s−1. The Dynisco LCR 7001 Capillary Rheometer utilises two methods for measuring pressure: pressure transducer or load cell. In this test, the pressure was measure by a Dynisco Vertex pressure transducer.
Results and discussion
Rheological behaviour is fundamental to any conversion process involving melt flow and solidification. The rate and magnitude of displacement for the polymer melt and solid is a determinant of the properties in the end product. The technique mentioned above was used to characterize the PEEK’s rheological behaviour over a broad range of steady shear rates. The data from the rheological test is displayed below in Figure 2. The two different batches of the same PEEK material exhibit the shear thinning behaviour at the shear rates tested.
Molecular weight is the main structural parameter of a polymers’ flow behaviour above its Tg or Tm. For polymers in general, melt viscosity is a constant at low shear rates, known as zero shear or Newtonian region. In lower molecular weight polymers, below the critical molecular weight is where the chains begin to tangle and zero shear viscosity becomes dependent on molecular weight, the zero-shear viscosity is proportional to the polymers molecular weight. This molecular weight change will have a significant impact on how the material will perform in a manufacturing process. It will most likely lead to defective parts (voids, flash or not fully filled) or may push the process parameters beyond the acceptable process window required to produce acceptable parts.
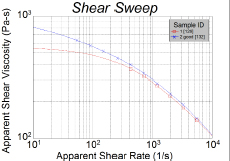
Figure 2: The viscosity of both batches of PEEK at various shear rates
Figure 2 represents the viscosity curve for two different batches of the same PEEK material. Batch 2 (blue line data) represents a stable process and acceptable part production. Batch 1 (red line data) represents the problematic batch which shows a significant reduction in viscosity at lower shear rates, most likely due to a molecular weight difference between the batches. Batch 1 could have been rejected upon delivery had an incoming inspection Shear Sweep test been performed using the Dynisco LCR 7001 Capillary Rheometer. This would have saved hours of production downtime and part failures.
In summary
Most feed polymer is assumed to be identical. However, sometimes one batch can be distinctly different to another. This can be problematic especially in the context of validated processes and a tight process control regime. Rheological measurements are essential for material characterization when studying or monitoring the conversion of thermoplastics from pellets (raw material) to finished parts. APT utilizes the Dynisco LCR 7001 Capillary Rheometer to compare batches. The typical result is a rheological curve that plots viscosity versus shear rate. Another typical and useful index for polymer quality control is a melt flow test that provides the mass-flow rate (MFR). However, MFR does not always provide sufficient information to identify subtle batch-to-batch variations. Rheological tests make it possible to simulate processing conditions with various combinations of deformation speeds and temperatures. Therefore, even the most discrete changes in structural properties of a polymer can be identified. The Dynisco LCR 7001 Capillary Rheometer facilitates fast & accurate methods of providing quality control for many aspects within the process.